Welcome
This website is a new tool which provides access to analytical outputs from the WISE-UP to Climate Project (see below). Outputs are displayed as interactive parallel axis plots, allowing many objectives of water resources system development to be considered concurrently. This allows the implications of different development strategies for diverse stakeholders to be better understood with reference to the complex interrelationships between them. Outputs were generated using stakeholder-informed numerical simulation models linked to heuristic search algorithms to efficiently filter the best performing combinations of development interventions from billions of practical possibilities.
The WISE-UP to Climate Project
WISE-UP is a project that demonstrates natural infrastructure as a ‘nature-based solution’ for climate change adaptation and sustainable development. It develops knowledge on how to use combinations of built water infrastructure (e.g. dams, levees, irrigation channels) together with natural infrastructure (e.g. wetlands, floodplains, watersheds) for poverty reduction, water-energy-food security, biodiversity conservation, and climate resilience.
WISE-UP shows the advantages of combined built and natural infrastructure approaches using dialogue with decision-makers to agree acceptable trade-offs. It ran over a four-year period (2013-2017) and linked ecosystem services more directly into water infrastructure development in the Tana (Kenya) and Volta (Ghana-Burkina Faso) river basins (Fig. 1).
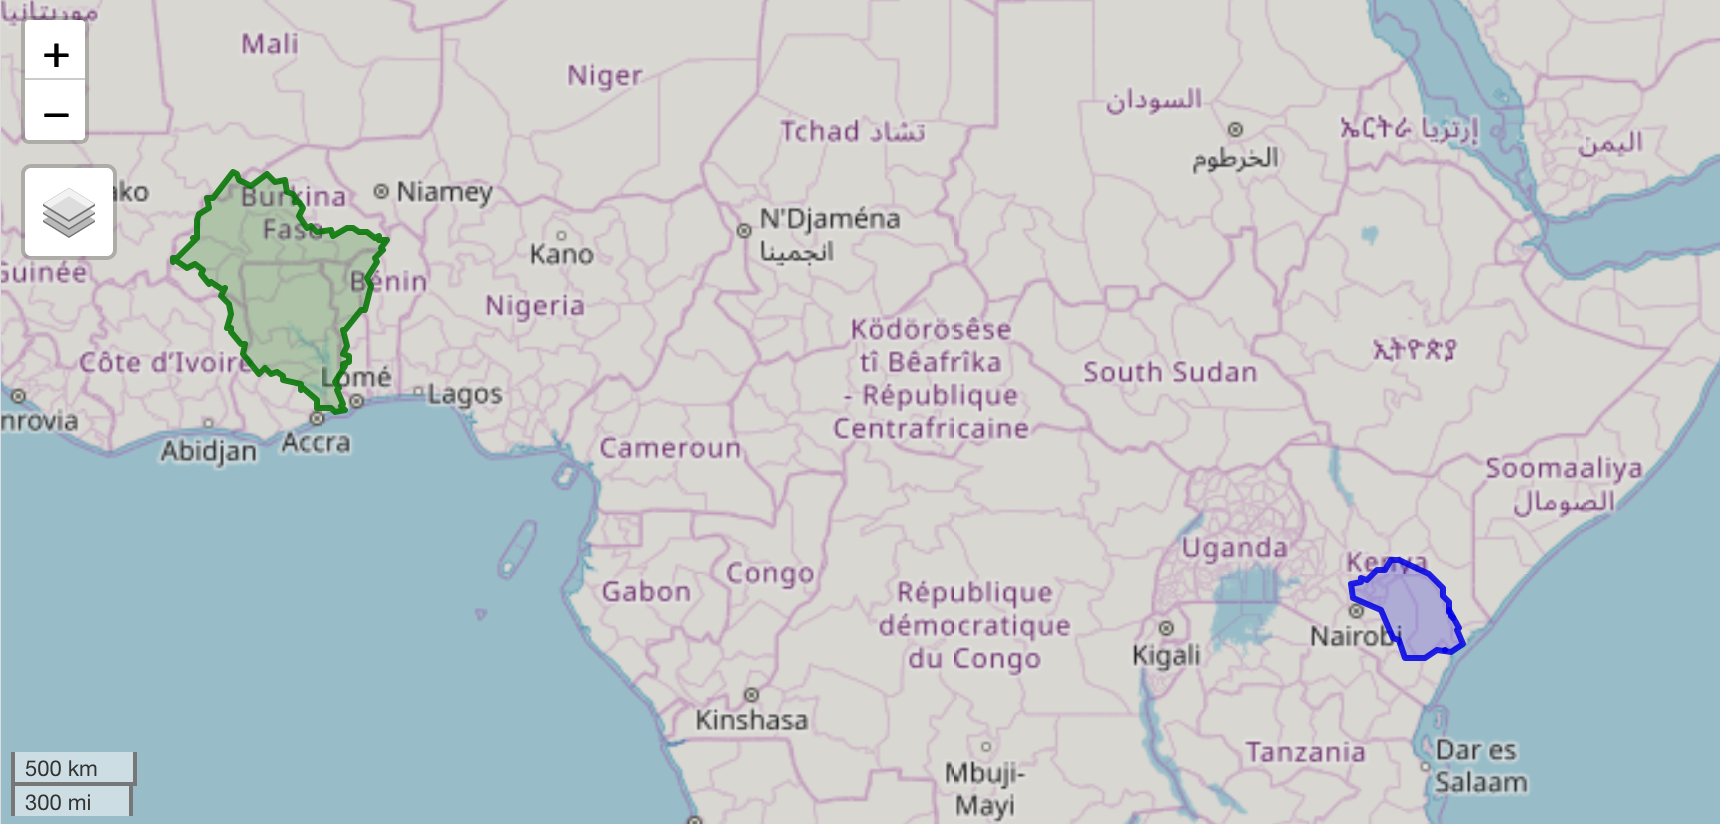
Fig. 1: The Volta (green) and Tana (blue) basins.
The outputs provided by this website relate to the ‘Ecosystem Infrastructure Investment Analysis’ component of the WISE-UP project. This comprised of systems simulation and optimisation using eco-hydrological functions, economic valuation and inputs from basin stakeholders supported by basin lead institutions and an action learning process (Fig. 2).
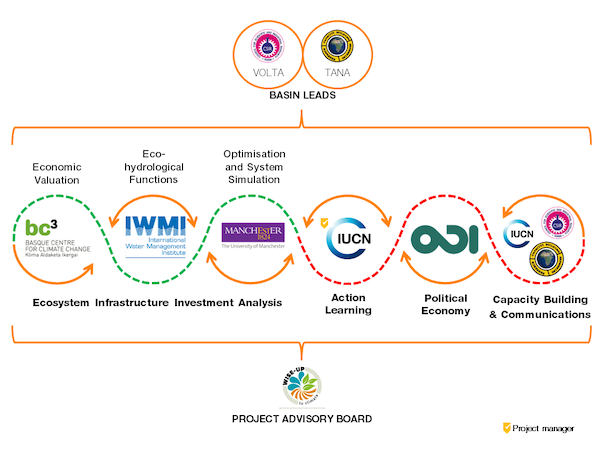
Fig. 2: The WISE-UP project structure.
Ecosystem Infrastructure Investment Analysis Methodology
For each basin, a numerical simulation model was built including all significant existing natural and built water resource system infrastructure and the proposed infrastructure in the basin (i.e. new dams and irrigation schemes). The model simulates flow and storage variations through the basin over a simulated time horizon and evaluates the performance of the system outputting performance metrics.
The model simulates 360 years representing plausible conditions in the 2050s, composed of 12 climate change scenarios for the years 2035-2064 (30 years). These scenarios were generated from different downscaled and bias-corrected Global Circulation Model datasets.
Performance metrics were co-developed with basin stakeholders from a number of organisations through bilateral meetings and a multi-lateral Action Learning process. Metrics are each a summary statistic of a benefit function developed from existing datasets, geophysical and hydrological relationships, field measurements, satellite imagery and expert judgement. Although not necessary for trade-off analysis, the WISE-UP to climate project also estimated the monetary values of the metric results where possible.
When new infrastructure or operating rules are implemented, the benefits gained from the system can be affected. The simulation models was linked to an heuristic search (multi-objective evolutionary algorithm (MOEA)) to find the best combinations of future infrastructure and operating rules (i.e. intervention) for maximising system performance. As some performance metrics conflict, there is no single best intervention. The analysis identifies a set of the best available interventions and the different trade-offs between benefits they imply.
These trade-offs can be analysed using interactive parallel axis plots (linked below). Within the plots, each blue line represents a unique intervention (combination of infrastructure and operating rules) and its performance is indicated by where it crosses each axis. The top of each axis represents the highest performance so an ideal intervention would be a blue line across the top of all axes.
The Volta Basin analysis was performed on two scales: the Upper White Volta focusing on the proposed Pwalugu dam and the White Volta Basin up to the Akosombo dam. The Pwalugu case-study examined the change in basin benefits from building the Pwalugu Dam with and without an irrigation scheme and the Bagre Aval dam. It also considered the possible effects of irrigation expansion upstream at Bagre in Burkina Faso. The White Volta analysis additionally considered a number of new hydropower reservoirs (Juale, Daboya, Jambito), the Kulpawn irrigation scheme and increasing public water supply abstractions and considered the change in performance of the Akosombo-Kpong hydropower system.
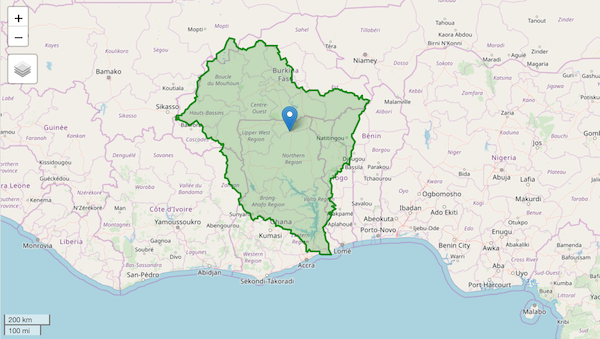
Fig 3. The Volta basin. The Pwalugu dam is show with the pin.
The metrics considered in the Pwalugu case-study are listed in Table 1 while the metrics for the White Volta analysis can be seen in Table 2.
| Metric | Description |
|---|---|
| Capital Costs (US$M/year) | Capital costs of new built infrastructure |
| Energy in White Volta Basin (Gwh/year) (US$M/year | Mean annual energy generation in Ghana and Burkina Faso |
| Irrigation yield (US$M/year) | Mean annual irrigation yield in Ghana and Burkina Faso |
| Flood Recession Farming (Ktons/year) (US$M/year) | Mean annual flood recession farming yield downstream of Pwalugu |
| Pond Fishing (tons/year) (US$M/year) | Mean annual fish catch from flood recession ponds downstream of Pwalugu |
| Reservoir fishing (Ktons/year) (US$M/year) | Mean annual fish catch from Pwalugu reservoir |
| Total generation (USDm/yr) | Mean annual combined monetary value of generation from Tana River hydropower dams. |
| Metric | Description |
|---|---|
| Capital Costs (US$M/year) | Capital costs of new built infrastructure |
| Energy in White Volta Basin (Gwh/year) (US$M/year | Mean annual energy generation in Ghana and Burkina Faso |
| Akosombo Kpong Energy (GWh/year) (US$M/year) | Mean annual energy generation at Akosombo-Kpong |
| Irrigation yield (US$M/year) | Mean annual irrigation yield in Ghana and Burkina Faso |
| Flood Recession Farming (Ktons/year) (US$M/year) | Mean annual flood recession farming yield downstream of Pwalugu |
| Pond Fishing (tons/year) (US$M/year) | Mean annual fish catch from flood recession ponds downstream of Pwalugu |
| Reservoir fishing (Ktons/year) (US$M/year) | Mean annual fish catch in Ghana |
| Urban water supply increase (Ml/day) | Total increase in public water supply |
Tana Basin analysis used a simulation model of the middle and lower Tana Basin in Kenya, from Masinga reservoir to the Delta. The performance of the water resources system was evaluated by simulating the current system and possible future systems, including interventions such as changing dam operating rules, a multi-purpose dam investment and four large irrigation scheme investments (these are ‘Decision Variables’). The metrics in Table 3 are each a summary statistic of a benefit function (Hurford et al, in preparation) developed using pre-existing datasets and expert judgement.
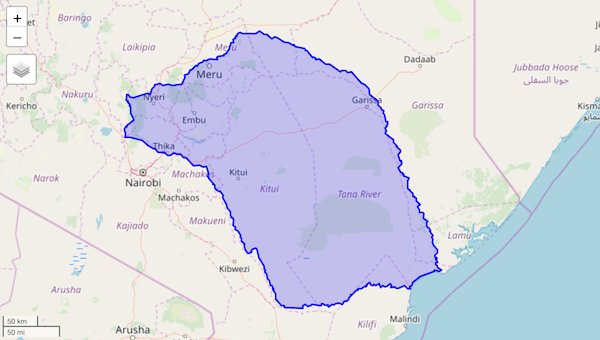
Fig. 4: The Tana basin.
| Metric | Description |
|---|---|
| Flood damage (USDm/yr) | Mean annual value of flood damage in the lower Tana. |
| Flow regime alteration (-) | Difference between the natural and modified flow duration curves at Garsen. |
| Min Floodplain benefit (USDm/yr) | Minimum annual combined monetary value of ecosystem services benefits in the lower Tana over the 360-year simulation. |
| Av Floodplain benefits (USDm/yr) | Mean annual combined monetary value of ecosystem services benefits in the lower Tana over the 360-year simulation. |
| New Irrigation Revenue (USDm/yr) | Mean annual revenue from new irrigation schemes implemented in the lower Tana. |
| Reserve flow breaches (no./yr) | Mean annual number of occasions on which flow falls below the defined environmental reserve flow at one of the two monitoring stations at Garissa and Garsen. |
| Total generation (USDm/yr) | Mean annual combined monetary value of generation from Tana River hydropower dams. |
Explore the Tana Basin Outputs here.
Click here for help using the Polyvis tool.